WUA Xplained #3: The Digital Sales Model – Advanced
In a previous article in our ‘WUA Xplained’ series, we showed you WUA’s Digital Sales Model and its building blocks. The Digital Sales Model is a visualization of the digital sales journey of customers, which takes place in six consecutive steps:
Findability, First Impression, Continue, Further Look, Preference and Order/Application Process. The model fits on a theoretical level with customer journeys in various markets (e.g., Insurance, Telecom, or Finance). Moreover, it has been successfully validated using multiple statistical methods. This article will give you more insight into some important aspects of the Digital Sales Model. You will learn about:
- What the model looks like (see this article for more detail)
- How we created and refined the model in multiple steps
- How we tested the model using both qualitative and quantitative pilots
- The ability of our model to prioritize CX-issues and predict consumer preference
The six phases of the Digital Sales Model
In a nutshell, the Digital Sales Model consists of 6 consecutive phases that take place during the customer journey (see Image 1 below):
1 – Findability
Are consumers able to find your website while searching for a product? If so, through which route?
2 – First Impression
How do consumers evaluate the first 0-60 seconds on your website?
3 – Continue
Are consumers willing to further explore your website, based on their first impression?
4 – Further Look
How do consumers assess your website on a deeper level, while fully exploring the presented content, pricing, and offer?
5 – Preference
After comparing multiple websites, do consumers ultimately choose your website to buy/apply for the desired product?
6 – Order/Application Process
After choosing your website, how do consumers evaluate the process of ordering/applying for the desired product?
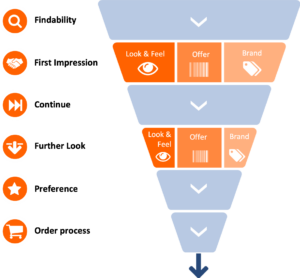
The WUA Digital Sales Model consists of three themes in both the First Impression and the Further Look phase of the customer journey.
Per phase, all three themes consist of a set of open-ended and closed questions on information, products offered, contact options and brand image.
Creation & refinement
All six phases of the Digital Sales Model are linked to a variety of closed and open-ended questions. These items form the basis of our standardized research questionnaire, with which participants evaluate the customer experience on a given website or app. We created and carefully refined the questionnaire items in three consecutive steps, based on our research expertise:
Starting with a meta-data analysis, we looked at over 100.000 website evaluations with our previous questionnaire to learn which questions help us in measuring online experience best, prioritize CX-issues and predict consumer preference. Moreover, this analysis taught us more about how respondents fill out the questionnaire, where they drop out, and how we could enhance the questionnaire experience for respondents to ensure the completeness of our questionnaire, we categorized thousands of open-ended answers. What do consumers say about what they find important during a website visit? This led to a few additional elements that we integrated into our model.
Next, we re-analyzed all the questions content wise. Is the wording of our questions clear? Are we really asking what we would like to know? During many brainstorm sessions with our digital experts, we reworded the universal online customer journey and transformed it into an improved questionnaire.
Putting the Digital Sales Model to the test
After the creation and refinement of our Digital Sales Model, we ran several tests. This way, we objectively made sure that our model reflected the real-world consumer experience, and that it was statistically sound and powerful. In total, we executed three tests:
In a qualitative test, we invited participants to our office to complete the questionnaire and provide us with extensive feedback. Among many insights, this pilot provided us with an even better understanding of how consumers form their first impression on a website. This insight enables us to further optimize our model.
Moreover, we conducted two quantitative tests to thoroughly check our questionnaire on a statistical level. In these pilots, we used a variety of statistical methods to answer three main research questions:
- Are the themes and the questions they consist of interrelated in a way that fits with our theoretical model? (research method: factor analysis
- Does every question add value to the model? (research method: correlation and reliability analysis)
- Do the questions enable us to predict which website is ultimately preferred by the consumer? (research method: regression analysis)
Based on the statistical output we gained from analyzing over 3.000 website evaluations, we selected the very best questions to measure the online customer journey accurately while keeping the questionnaire as concise as possible.
Prioritizing CX-issues with predictive modelling
What has the extensive refinement and testing of our Digital Sales Model yielded? Well, one of the most important benefits of the model is its high predictive power. Overall, the elements in our model predict in 80 percent of all cases which website consumers give the highest overall opinion! Overall opinion is strongly connected with preference. This means that we measure (nearly) all relevant aspects of the customer journey in our model.
More specifically, we can perform predictive modelling via regression analyses. This means that we can use the scores on the 3 main themes of the model (i.e., Look & Feel, Offer, and Brand) to make accurate predictions about consumer behavior on any given website.
Looking at the building blocks of the model, we can calculate (using regression analyses) the relative importance of each theme in the First Impression, when it comes to consumers deciding whether to continue on the website they visit. When combined with the CX-scores that are related to these themes relative to those of competitors, we can pinpoint the most impactful CX-issues that stop visitors from further exploring the website.
Moreover, we can calculate similar CX-priorities in the Further Look phase: by conducting regression analyses on the themes Offer and Brand in this phase (since Look & Feel has a more indirect impact here), we know which themes are most important in creating consumer preference for a website within a market. Pairing this data with the CX-scores of underlying components of the themes (e.g., perceived expertise, price perception) and comparing them to scores of competitors, CX-priorities come to light.
Let’s look at an example (see Image 2 below): company A might perform well online on most brand-related elements compared to competitors, but might lack a clear product offer. In this example, product offer is highly important for generating preference for that website within the market. As a result, consumers prefer competitor B that does slightly better in presenting their products. If website A wants to increase the preference they get from consumers and thus, increase conversion and market share, the model shows that they need to improve offer-related components on their website to beat competitor B.
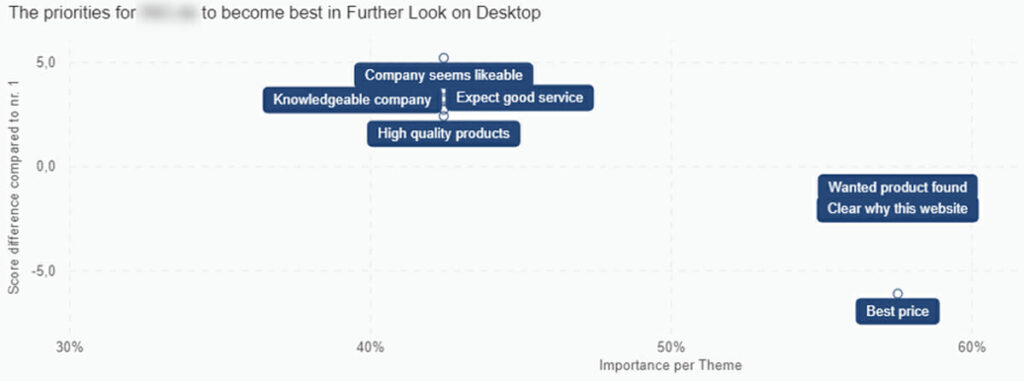
Image 2: The Priority Matrix for company A in the Further Look phase on desktop. The x-axis represents the relative importance of the themes Product Offer and Brand (the graph shows the questions these themes consist of) in generating overall opinion. The y-axis represents score difference on these questions, relative to the best scoring competitor in the market.
Helping our clients flourish digitally
To wrap up, we are continuously putting a lot of effort into optimizing our Digital Sales Model and questionnaire. We do so to help our clients even better than before with enhancing their online conversion. All adaptations and refinements to the model are made with our ultimate goal always in mind: helping our clients become and remain the best in the digital arena!