 general
2 min•Whitepaper
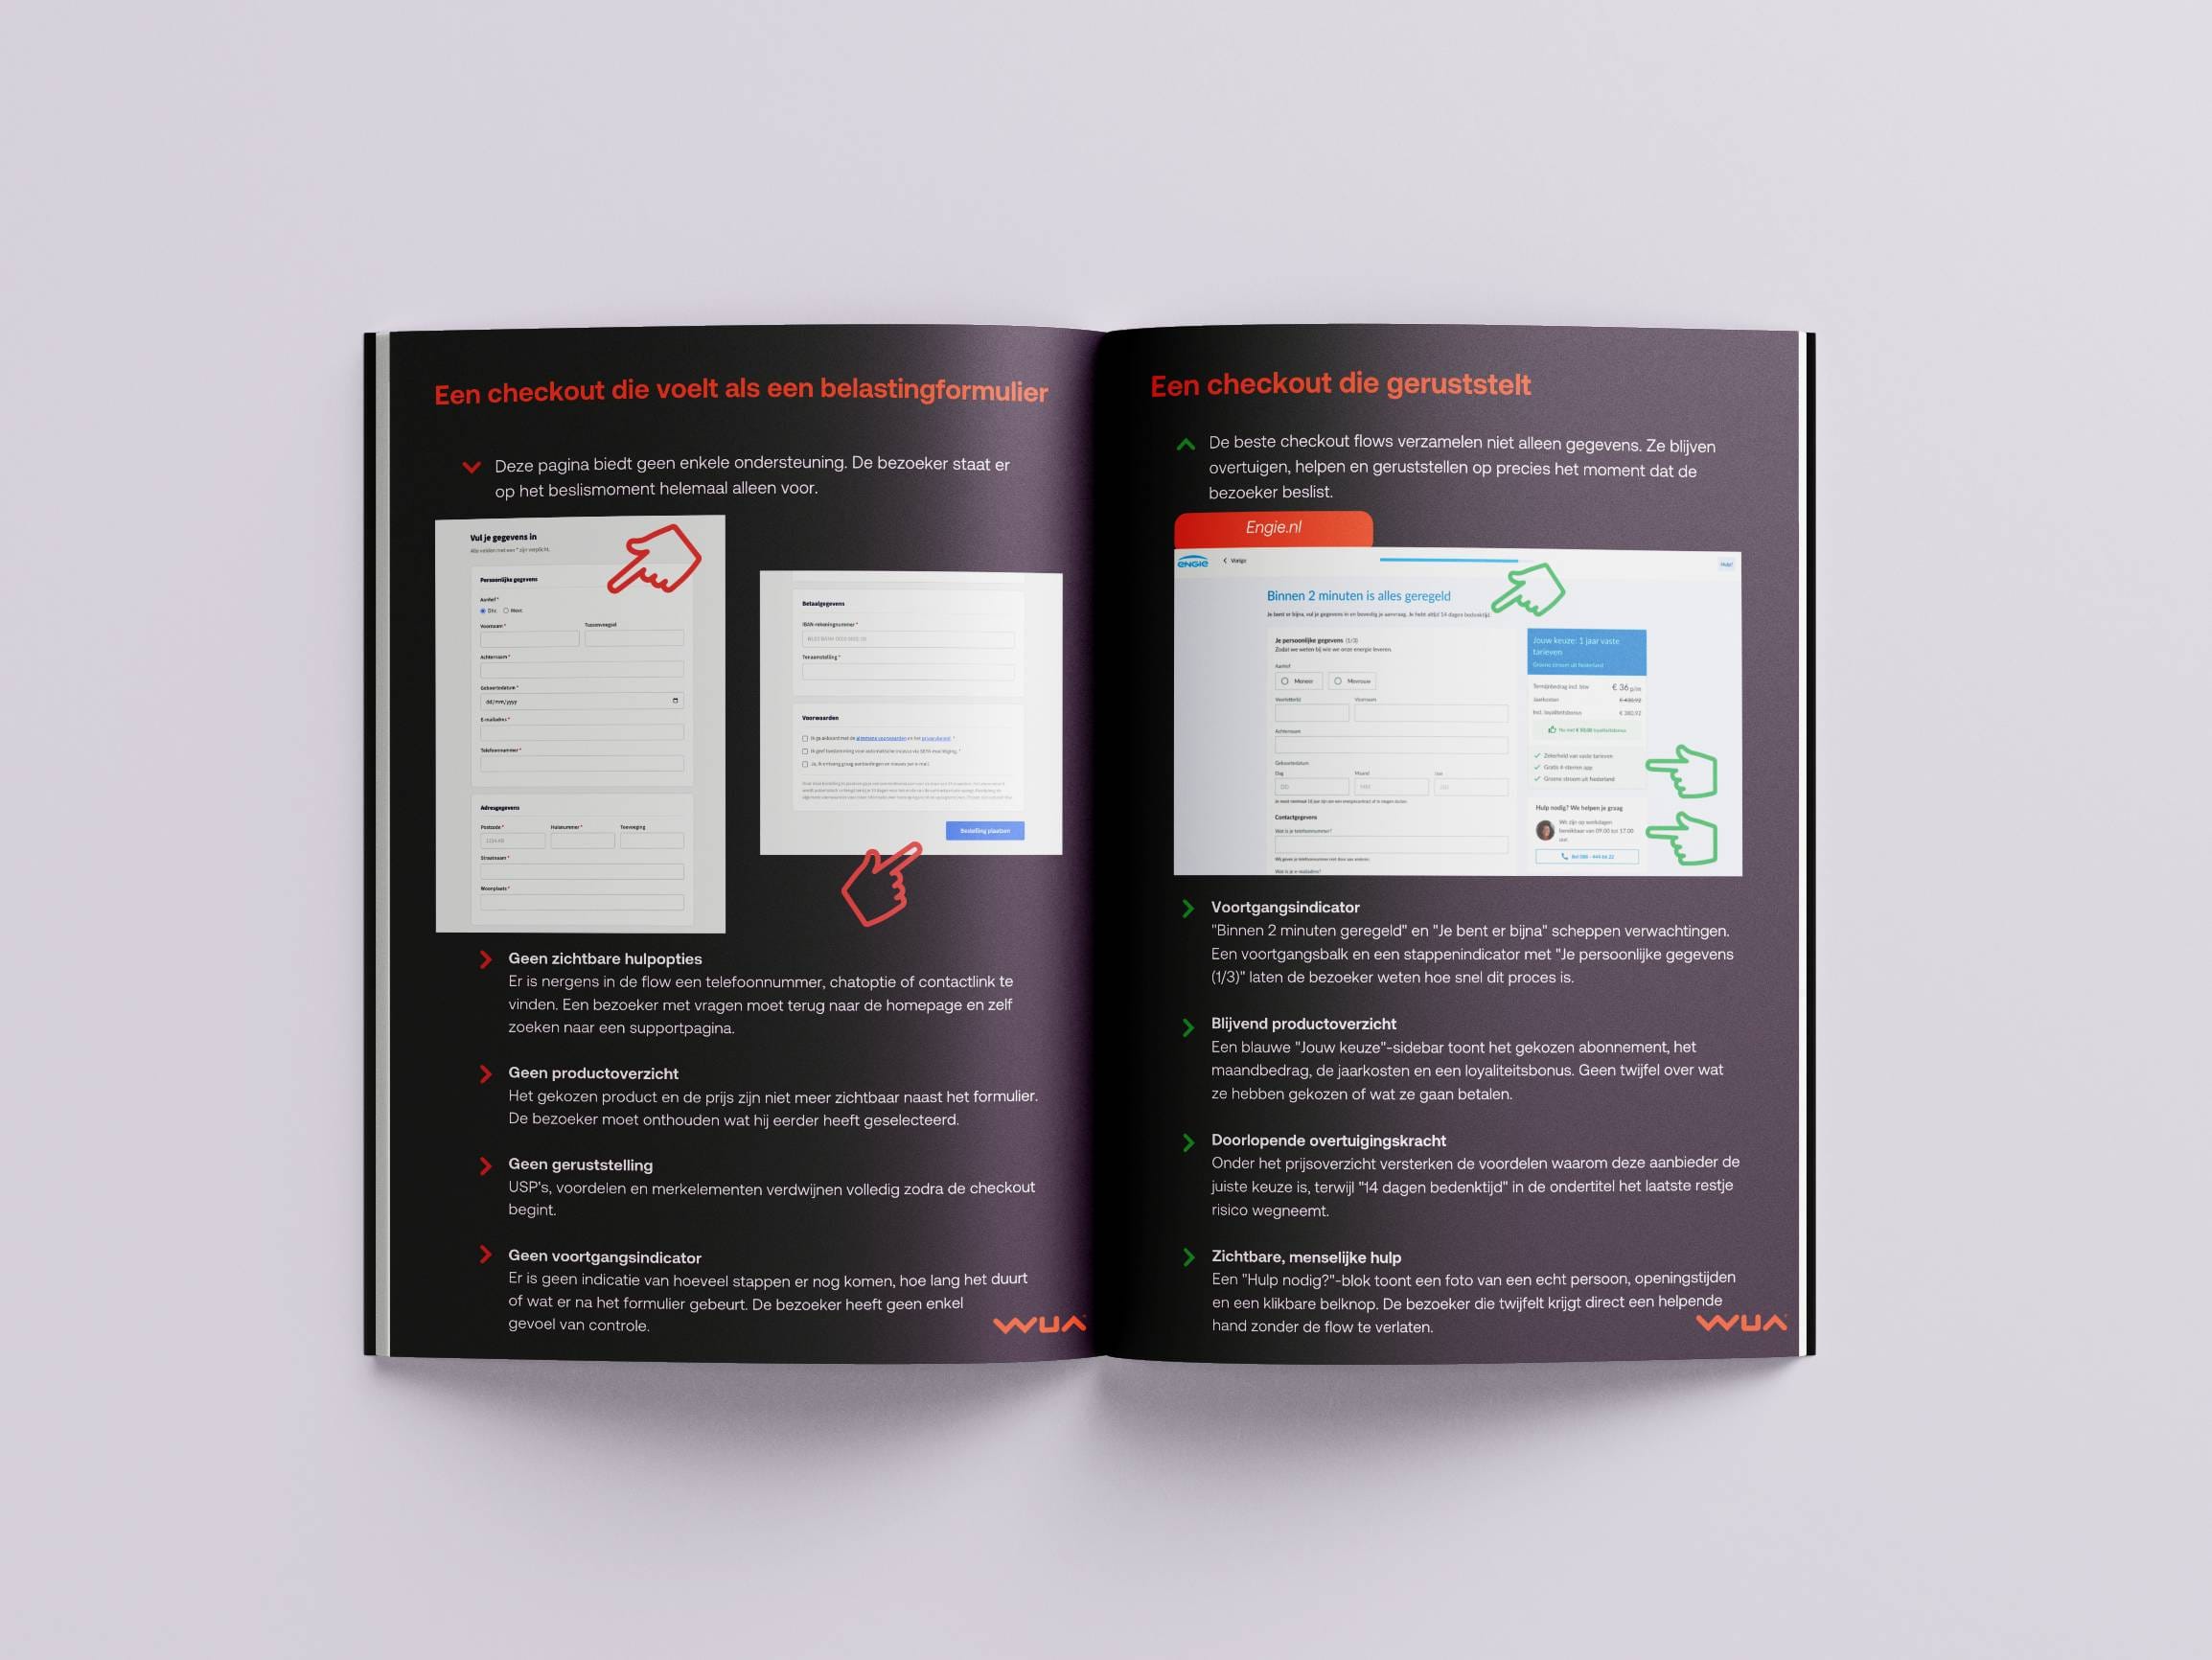
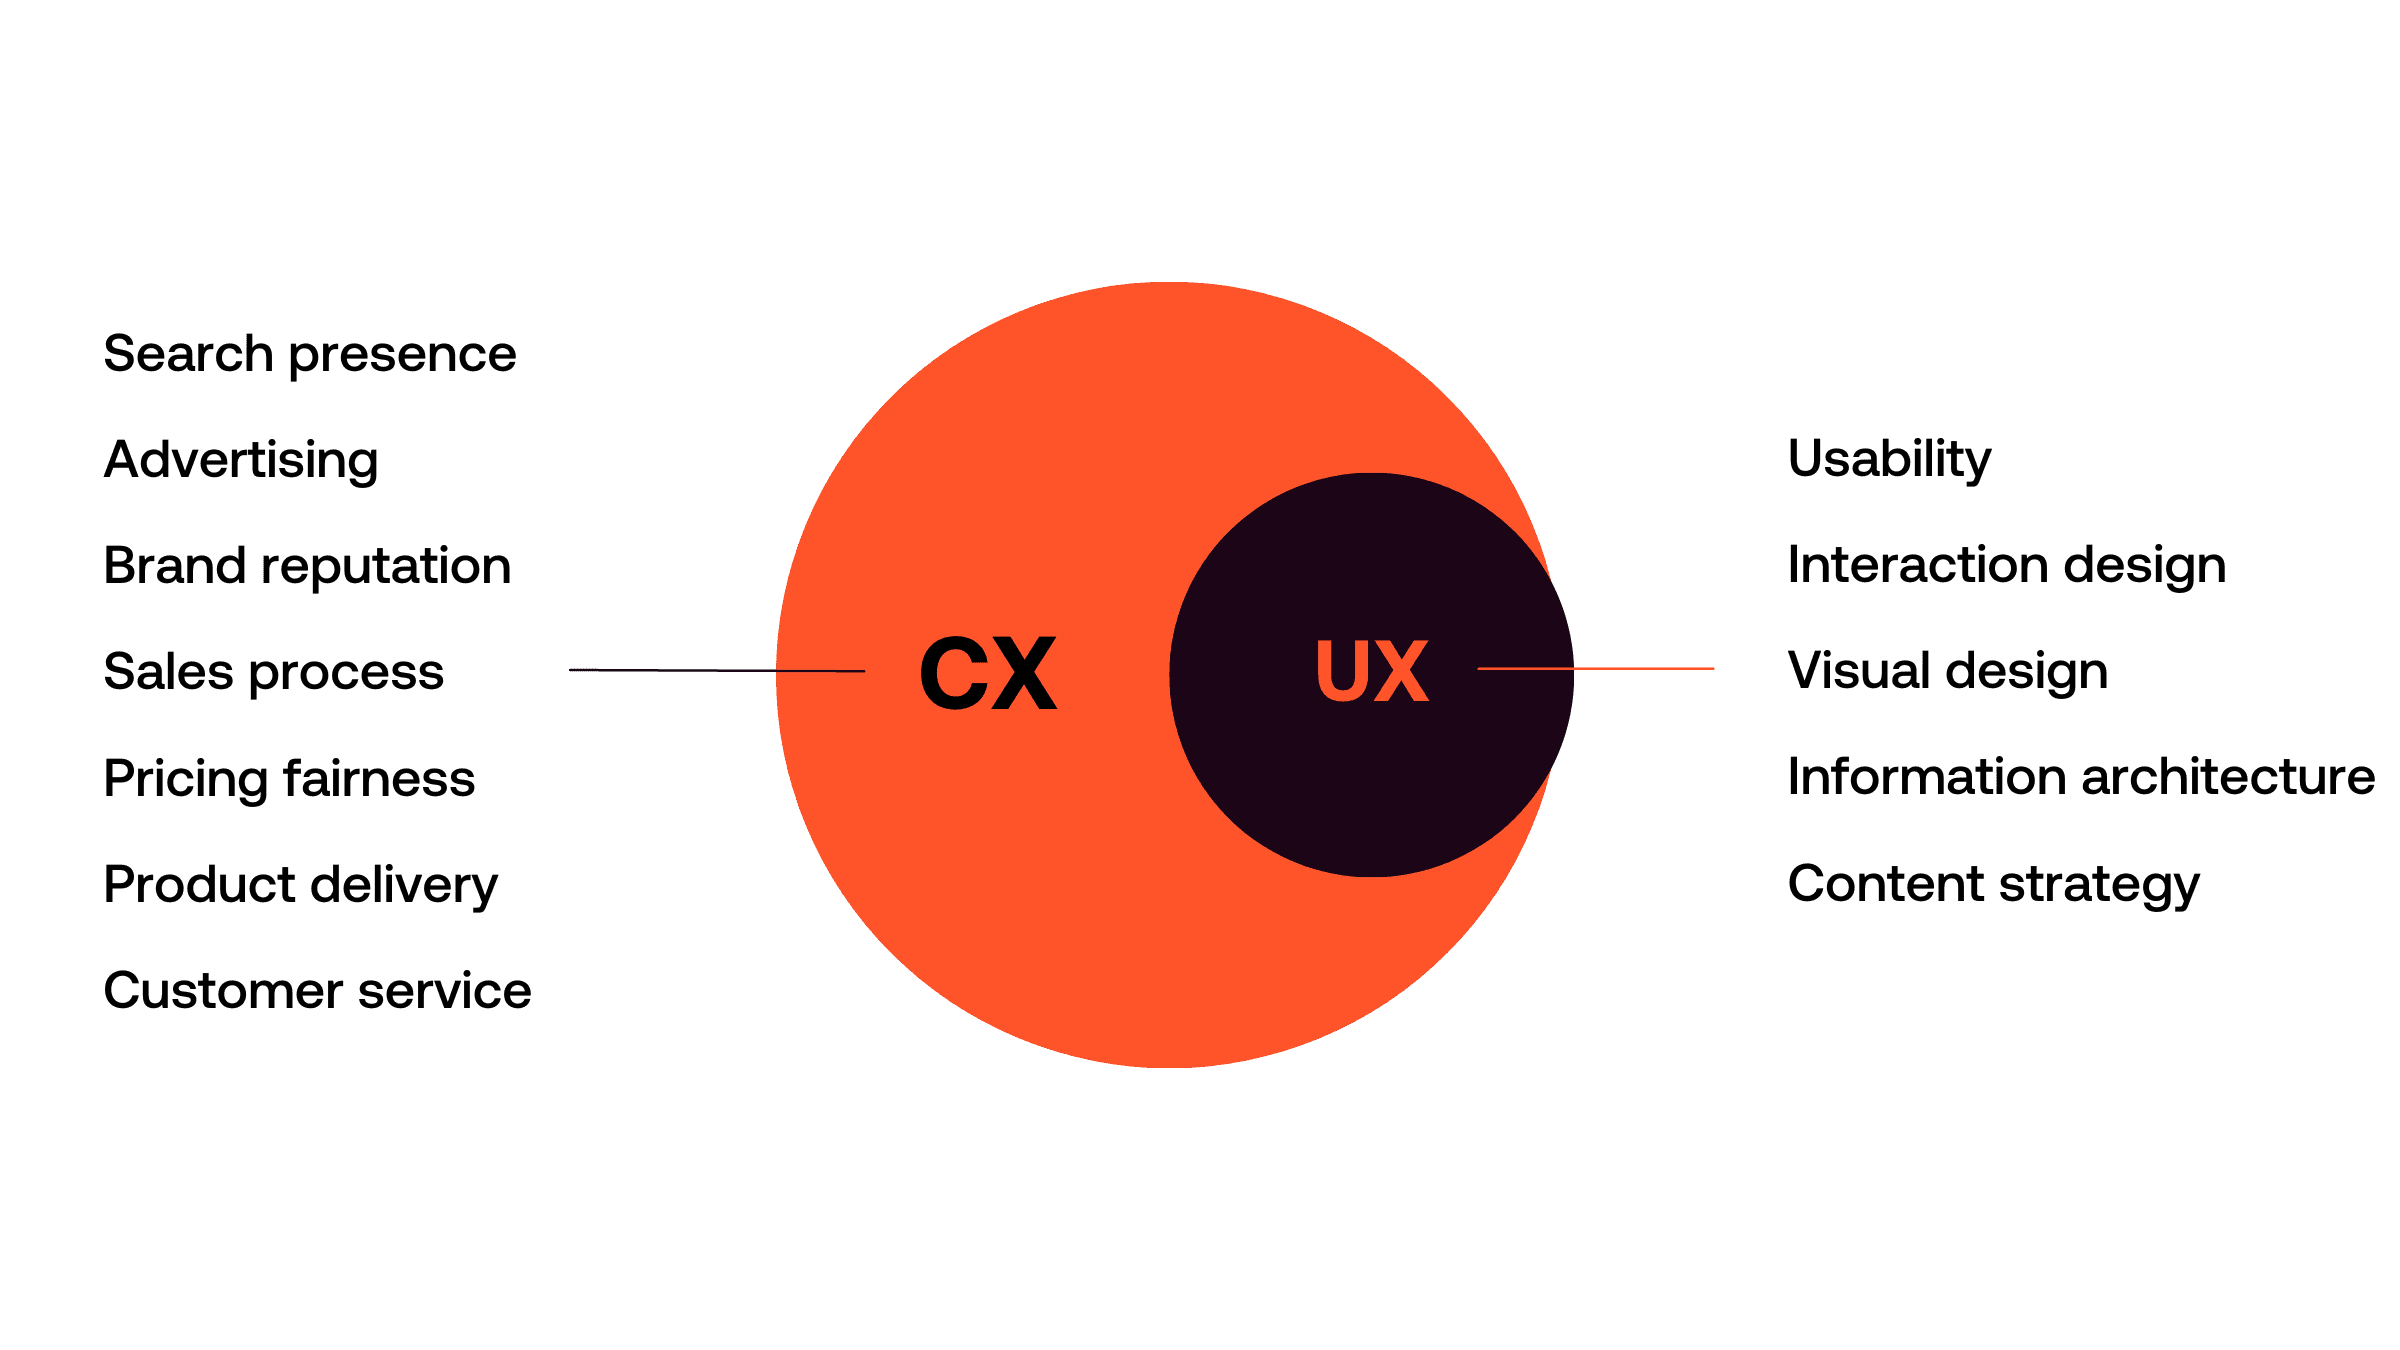
Guide to measuring digital customer experience through tools and metrics. Explains the difference between UX and CX, and how quantitative and qualitative measurements drive optimization.
Discover how WUA can help you outperform the competition.