Key takeaways
-
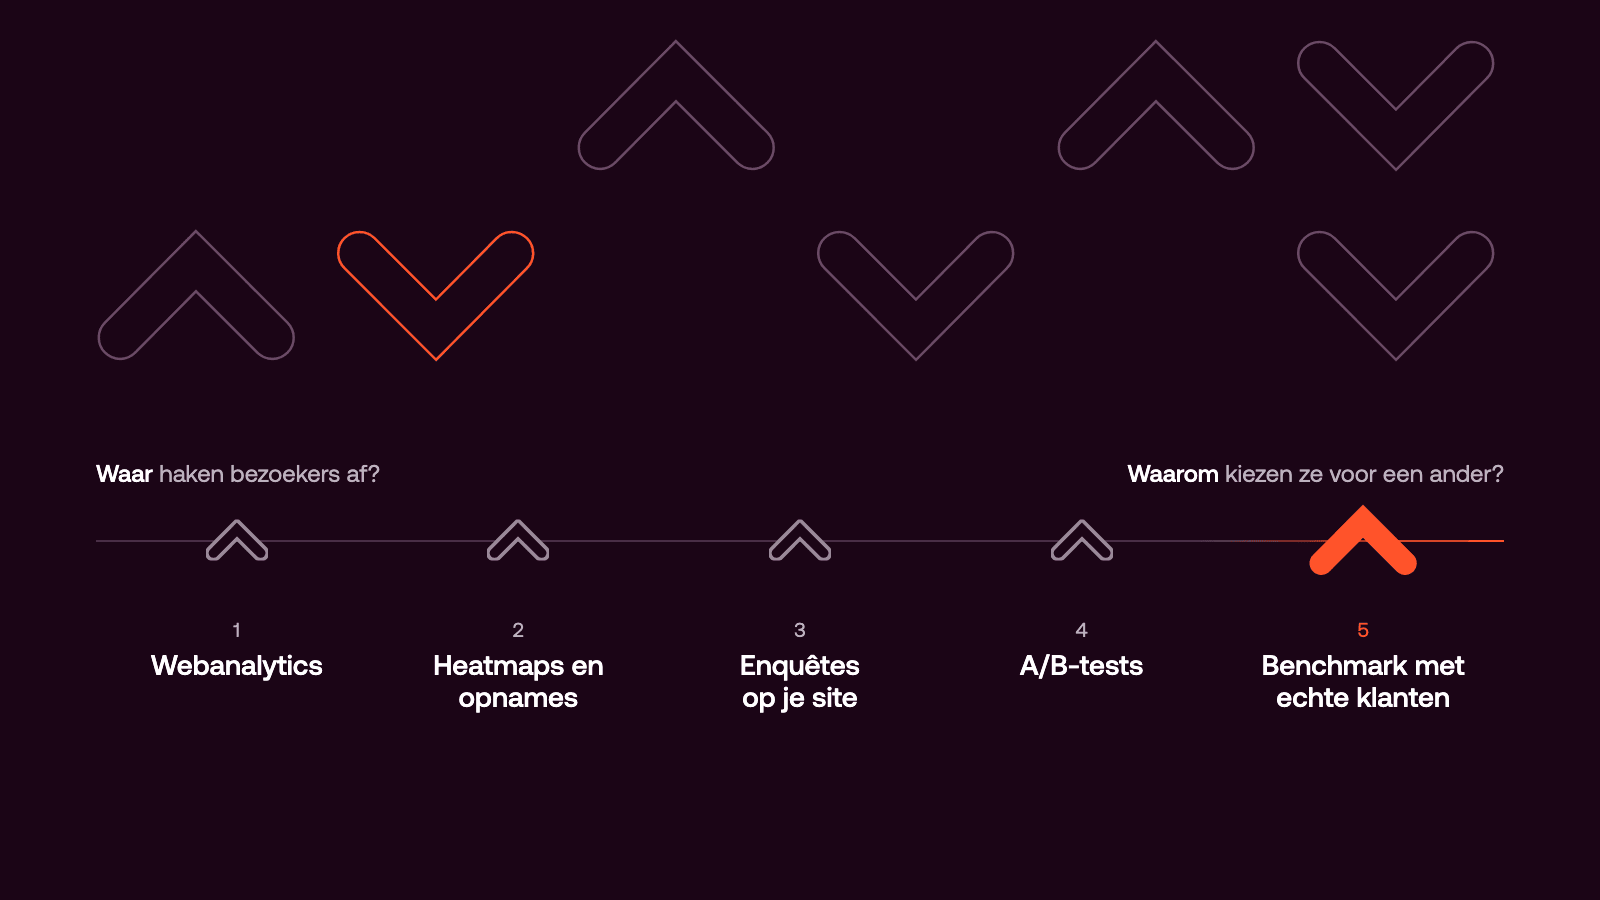
There are five ways to measure your website's customer experience: web analytics, heatmaps and session recordings, on-site surveys, A/B tests and a benchmark with real customers.
-
Analytics and behavior tools show where visitors leave. Surveys and benchmarks explain why, and only a benchmark shows how your site compares with your competitors' sites.
-
Start from the decision you need to make, not from the tools you already have, and combine two or three methods in a fixed order.
-
A/B tests need more traffic than most teams expect, so on low-volume flows like mortgage or business insurance applications they often come last or not at all.
What are you actually measuring when you measure CX?
Two things, really: what visitors do on your site and what they think of it while they're doing it. The first is behavior, like where they click, where they hesitate and where they give up. The second is perception, like whether the price makes sense to them, whether they trust you and whether they found what they came for. That perception weighs more than most dashboards suggest. In WUA's benchmarks, 67% of participants choose the website they rated best themselves, against 29.5% if it were down to chance (the Netherlands, 105,358 people, 2018-2026).
How do you know which method you need?
It mostly comes down to four questions.
-
Do you need the where or the why? Some methods show you where visitors leave and others explain why. Most teams have plenty of the first and very little of the second.
-
Is it just you, or everyone? A customer who leaves your site usually goes to a competitor, and a method that only looks at your own site can't tell you whether a problem is yours alone or one the whole market shares.
-
Do you have the traffic? Some methods only work with a lot of visitors, which rules them out for many banking, insurance and B2B flows.
-
Who are you hearing from? Some methods cover every visitor, while others only reach the small group who choose to respond.
What are the 5 ways to measure your website's customer experience?
| Method | Answers | Misses | Best for |
|---|---|---|---|
| Web analytics | Where do visitors leave? | Why, and visitors who declined cookies | Finding the problem step |
| Heatmaps and recordings | What happens at that step? | What visitors were trying to do | Spotting concrete friction |
| On-site surveys | What do visitors say? | Everyone who doesn't answer | Collecting new explanations |
| A/B tests | Which version works better? | Why it wins | Confirming a specific fix |
| Benchmark with real customers | Why do customers choose a competitor? | Day-to-day traffic changes | Setting priorities against the market |
1. Web analytics (Google Analytics)
Analytics covers every step of every visit, which makes it the right place to find where the problem is. It's best for spotting the page or step where visitors leave and for checking afterwards whether a fix worked. Before you read anything into a funnel, check that the drop-off is real, since an event that fails to fire or a page that reloads looks exactly like a visitor leaving, and split the numbers by device, traffic source and new versus returning visitors, because an alarming average often sits in a single segment.
2. Heatmaps and session recordings (Hotjar, Microsoft Clarity, Contentsquare)
Behavior tools let you watch what happens at the step you found, and signals like rage clicks (someone clicking repeatedly on something that doesn't respond) or long pauses above one form field often point straight to a concrete problem. They're best for teams that already know where to look. Keep in mind that heatmaps blend mobile and desktop unless you split them by device, and that the dramatic recordings shared in meetings are rarely the most common problem.
3. On-site surveys (Typeform, GetFeedback)
A survey is the cheapest way to hear reasons in the visitor's own words, and one open question shown when someone is about to leave a step usually teaches you more than a rating scale on every page. It's best for collecting explanations you hadn't thought of. The people who respond are a small and self-selected group, so use the answers to generate ideas and not to judge how big a problem is.
4. A/B tests
An A/B test is the most rigorous way to confirm that a change works, and it's best for a specific idea on a step with plenty of traffic. That traffic is the catch: a step converting at 2% needs about 81,000 visitors per version to detect an improvement to 2.2% with 95% confidence and 80% power. A test also only compares the versions you designed, so it tells you which idea wins without telling you why.
5. Benchmark with real customers (WUA)
In a benchmark, real customers who match your target group do the same tasks on your site and on your competitors' sites, and they tell you what they notice and how it feels. At WUA that is 150 to 200 people per study, each doing the same task on several websites in one session, so the scores compare directly.
It's best for deciding what to fix first, because the comparison changes your priorities: a problem every competitor shares costs you little, while a problem only your site has is exactly where a comparing customer decides to leave. One benchmark measures one moment, so it works alongside your analytics and doesn't replace it. Repeated every quarter, it shows whether your position against the market is moving.
So where do you start?
With the decision in front of you. The order that works for most teams is analytics to find the step, recordings and a survey to collect explanations, a benchmark to see which explanations are specific to you and how much they matter, and an A/B test to confirm the fix where traffic allows it.
A few questions worth asking your team first:
-
Do we know where visitors leave, or only that conversion is down?
-
Do we know whether this problem also exists at our competitors?
-
Does this step get enough traffic to run a reliable A/B test?
-
Which decision will this measurement support, and who is waiting for it?
Frequently asked questions
What is the best way to measure customer experience on a website?
There isn't a single best method, because each one answers a different question. Most teams combine analytics to find the problem step with a benchmark or survey to understand why visitors leave.
Is a free tool like Microsoft Clarity enough?
For watching behavior on your own site it often is. It won't tell you why visitors stop or how your site compares with a competitor's.
How much traffic do I need for an A/B test?
That depends on your current conversion rate and the smallest improvement you want to detect. A free sample size calculator gives you the number before you start, and if it's out of reach, a careful before-and-after comparison per segment is the next best option.
How often should I measure customer experience?
Analytics and behavior tools run continuously. A benchmark makes sense before a bigger decision, such as a redesign, after a competitor relaunches or when conversion has been falling without a clear cause. Teams that want to follow their position against the market repeat it at a fixed rhythm, often every quarter.
What is a CX benchmark?
A CX benchmark compares how real customers experience your digital customer journey with how they experience your competitors' journeys, so you can see where you're ahead, where you're behind and which gaps cost you the most customers.